Hotel metasearch service####
Akasha - Wego hotels' metasearch backend is developed in Java with Dropwizard framework. It concurrently interacts with a lot of different partners' APIs to get live rates for any hotel or location.
Wego being a travel metasearch, Akasha is the heart of hotel metasearch service. When a user triggers a hotel search on Wego website for any location or hotel, the request flows to akasha to get live rates from our hotel partners in real time. These live rates get indexed in ES (Elasticsearch) which are then returned to our Web/Mobile apps.
Problems and Challenges####
Amount of Data
For every single search request, we make hundreds of API calls to partners and get thousands of responses. Every response returns multiple rates for each hotel which are then parsed to extract relevant information to be returned to our web/mobile apps. We also query a big amount of static data from the database such hotels, locations, partner's related data.
DB Calls
Each search request has multiple DB calls to prepare data for hotels, locations, ranking associated with each hotel. Each hotel is provided by multiple partners and hence this process takes place for every request that is fired to partners' APIs. This causes the biggest bottleneck every application has to face i.e I/O blocking.
Garbage Collection
Each request generates high numbers of objects which lead to frequent garbage collection and slows down the application performance which is inversely proportional to throughput.
Thread Contention
Each request received by the app creates multiple threads based on numbers of partners to complete the request, which increases the chances of common issues related to the multi-threading application of starvation and deadlock.
Text Repetition
Multiple String Object creation results in memory allocation which requires a lot of memory allocation which leads blocking memory space as String are immutable in Java.
Performance optimization####
Caching
In order to optimize the app, we started off with optimizing calls to the DB, by reducing no. of calls which lead to less network access and data transfer by adding Cache between the App and the DB. Every DB call contains data which can be reused for each search request and can be held for a longer time as it is less volatile than rates. We needed a sound caching solution that could provide the features we required, Guava Cache library from Google was one solution that fit our requirements well.
One of the best feature provided by Guava Cache is refreshing data asynchronously while returning fresh data in every single calls, so that application will not have any blocking IO situation.
Using a combination of expireAfterAccess and refreshAfterTime methods stale data is evicted from cache objects. expireAfterAccess sets specified duration after access which expires data after a specified duration. refreshAfterTime sets specified duration after which data is refreshed from the time of entry creation.
It's good to have an initial capacity of cache objects as it reduces the resizing process to accommodate more data, as resizing requires a considerable amount of system resources. As Cache objects are concurrent and store keys in form of hash and are divided in parts which are in equal proportion to the number of threads that can access it concurrently.
DB Connection Pooling
DB connections are expensive by resource and time as they are blocking, connections with a lot of switching between calls causing slow DB performance.
DB connection pooling is a solution for this where we keep some connection alive, which are always ready and can be used multiple times on any number of SQL calls. We did different load testing to find the upper and lower bounds for optimal numbers of connections which is needed by the application.
Object allocation and thread pool
Reduced String Object creation with static maps in classes which resulted in small repeated texts. This resulted in Refactored code for better readability and performance.
Map objects were created with initial capacity wherever fixed number of entries were known, using default load factor suggested by Java i.e. 0.75. It resulted in stopping aggressive rehashing process. Calculations were based on
fixedMapSize = (int) Math.ceil(numberOfMapEntries / 0.75) + 1
By using single search thread pool which is much more efficient, it reduces the number of threads and reuse available threads from the pool and only creates a new thread when not available from the pool itself. This helps in avoiding thread starvation and deadlock. With too many threads, context switching becomes a concern as CPU through scheduling mechanism has to assign each thread time for processing. The majority of CPU resources is consumed between context switching threads, reducing CPU performance as they live long requesting computing resources and blocking the context.
Garbage Collection Optimisation
GC is an integral part of Java application and can be optimized based on the requirements. Every application creates a lot of objects and generates lots of data while processing different requests, with varying lifespan. As soon as they go stale they are cleaned up by GC provided by Java to create space for new Objects.
Out of all the available garbage collectors G1 is recommended for servers with large heap memory and requires lesser pauses during collection time. G1 stands for Garbage First, which means it searches for the regions where it can find more numbers of objects which can be garbage collected easily and cleans them first for more memory.
With G1 heap memory is divided in numbers of regions varying in sizes 1MB to 32MB, strategically by garbage collector. Furthermore each region is sub-divided in many smaller memory blocks, which are labeled as Eden, Survivor and Old generations. Eden and Survivors collectively called as Young generations. When an object is created, it is assigned to Eden memory block. during garbage collection when an object is not garbage collected it moves to Survivor section and from there on move to old generation eventually, these are completely done by garbage collector over the period of object life cycle.
How G1 achieves less pause time compare to other garbage collectors ?
G1 GC runs concurrent threads = 1/4 * numbers of CPU cores with application threads, the cause of this is it looks like GC getting called frequently. While doing this it tries to restrict the garbage collection time within 200ms as a soft target by default.
Why optimization was needed?
We keep a lot of data in the cache, which eventually moves to old generation by GC and if persisted for too long without being accessed it gets dropped. This data was not getting cleaned up regularly by the old garbage collector, and because of which memory was running out of space. Due to memory being full, GC stops all application threads and runs cleaning with (number of cores)threads in parallel which takes somewhere between 2-5 seconds.
Strategies implemented to optimize GC were
-
Marking cycle to start if heap memory exceeds
60%XX:InitiatingHeapOccupancyPercent=60 -
Mixed garbage collection for old generations set to
20%-XX:G1OldCSetRegionThresholdPercent=20 -
Max number of old regions which can be collected while doing mixed garbage collection To remove string or text duplications through garbage collection process
-XX:+UseStringDeduplication
Because of these changes, the throughput of application improved to 99.54%, which means only 0.46% time was spent in GC activity. Which means out of 100 requests 99.54 requests were processed without any pause time from GC(This data is based on approximately 7 days of application run).
According to logs from 7 days of application run, only 15 times the GC pause time was more than 5 second out of 26680 GC activities. Average GC activity time was around 110ms. Max GC activity time was 13 seconds, which happened only once and was an outlier in this case.
Performance####
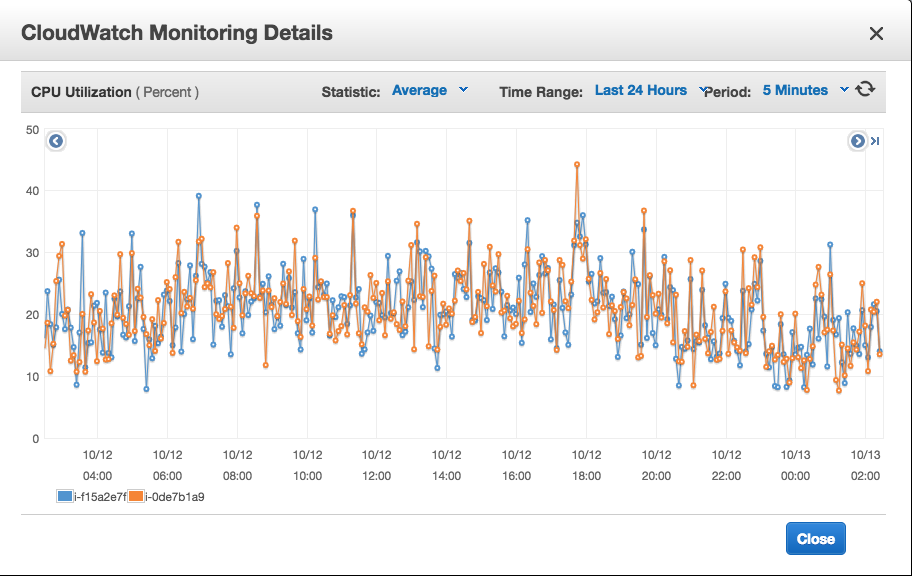
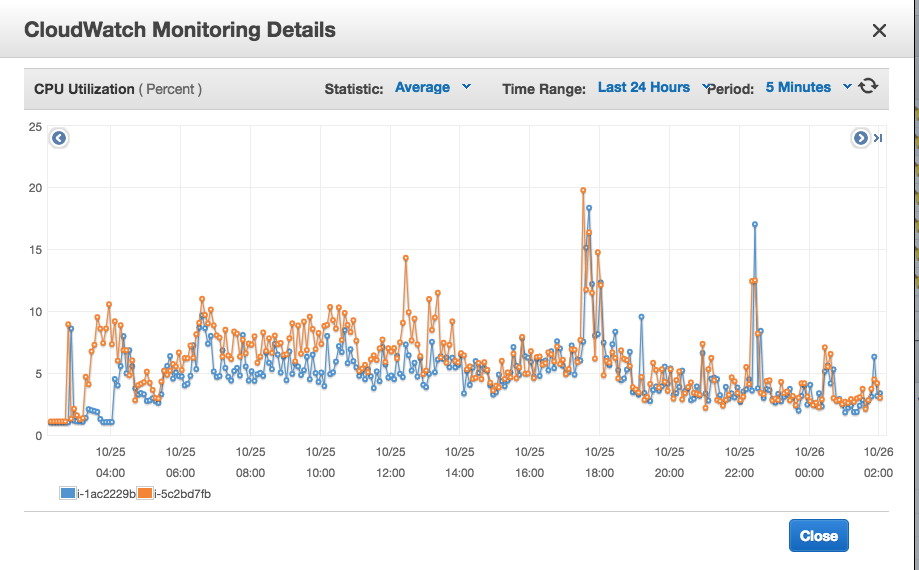
We got more stable servers with lower latency, higher throughput and smaller memory footprint compared to pre-optimisation. RAM was reduced to quarter of previous server and CPU average reduced by 40% (data from load testing).
View Comments