Re-architecting logging using Vector.dev
Scroll DownAt Wego, our constant focus is towards improving the quality, performance and managing cost. We use containers all running on AWS ECS & EKS . We collect both application & system logs to validate the transaction & troubleshoot any kind of issues or incidents.
Current Approach
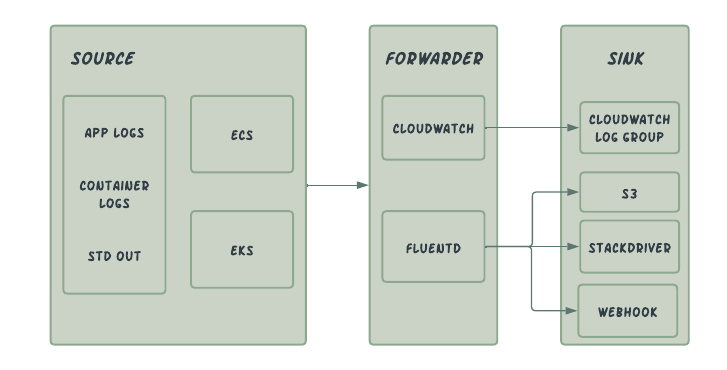
Bottleneck:
- Flutend's high memory usage was causing a bottleneck with growing buffer retries, which led to frequent service restarts.
- Filtering & querying logs in Cloudwatch has a steep learning curve for the developers.
- Cloudwatch logging is billed on how much data is ingested per log group. The increase in cost is directly proportional to the amount written and stored in cloudwatch.
- Log transfer to external source i.e Stackdriver incurs egress cost along with dependency to an additional service.
Re-Architected
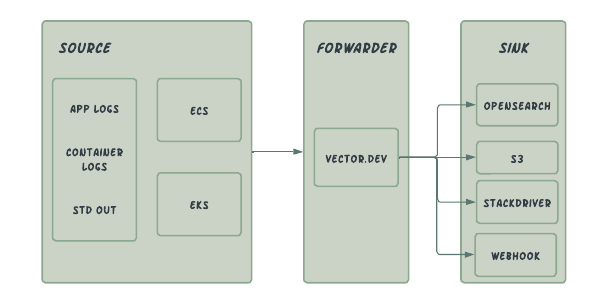
Why OpenSearch was chosen to replace Cloudwatch & Stackdriver
After Elasticsearch version 7.10.2, Elastic changed their software license removing it from being purely OSS. Since then AWS announced Opensearch as an alternative to Elasticsearch. Also OpenSearch comes with a built-in Dashboard (Same as Kibana) to visualise the log data and create charts and metrics out of the data. More details please refer here
As we deal with high volume of data due to nature of the business, we cannot afford to lose data. Hence we preferred to go with AWS Opensearch, a managed Solution rather than managing it ourself as a hosted Solution. We preferred to store the logs in OpenSearch for realtime search and data access for a period of time, as of now we retain data for 30 days.
Also AWS Opensearch supports SSO, which offload user experience and easy centralised access for everyone. For more details, please refer here
Why choose vector over Cloudwatch & Fluentd log drivers
Vector in there own words is a lightweight, ultra-fast tool for building observability pipeline, with low resource consumption designed to collect logs from various sources with the ability to transform them on the fly and send them over to multiple sinks. We currently use vector to collect logs from multiple sources, perform parsing and transformation before sending them to multiple sinks.
Vector configuration can write in TOML, YAML and JSON giving developers flexibility to write the configuration in a familiar language compared to XML based fluentd config. For transformation it uses a domain specific language called VRL.
Vector can be deployed as an agent or an aggregator. We use it in agent mode to collect logs from our ECS and EKS clusters.
Vector has built in tooling to help with monitoring and validating your configs and data.
Examples:
vector validate -> used to validate the config/syntax error
vector top -> shows quick status of the each components, like buffer, log sent, failed and number bytes
vector tap -> overview on events flowing into components (transforms, sinks) and out of components (sources, transforms)
Vector agent
Each ECS/EKS Cluster is deployed with Vector agent as Daemon services and receives the log from each task(ECS) & pods(EKS). Agent does the following
- Collecting logs from a file or stdout source
- Enriching logs with metadata about the containers like service name, container id, etc.
- Parsing logs into JSON readable format.
- Filtering out unwanted logs like ELB HealthCheck.
- Shipping logs to OpenSearch, S3 & web-hook.
How to configure Vector agent in ECS.
By default AWS ECS supports the below logging drivers.
AWS Fargate, the supported log drivers are awslogs, splunk, and awsfirelens.
For tasks hosted on Amazon EC2 instances, the supported log drivers are awslogs, fluentd, gelf, json-file, journald, logentries,syslog, splunk, and awsfirelens.
vector.dev driver was not support by AWS yet. Here is the Hack we did to forward the container logs to vector, without doing much changes. We chose splunk log driver since, it support both Ec2 & Fargate
Change 1: ECS Ec2 Instance by default support only awslogs which is used to send the logs to Cloudwatch. To start sending the log to Splunk need edit the below file.
vi /etc/ecs/ecs.config

ECS_AVAILABLE_LOGGING_DRIVERS=["splunk","awslogs"]
Change 2: Change the log configuration from cloudwatch to splunk.
 "logConfiguration": {
      "logDriver": "splunk",
      "options": {
        "splunk-url": "http://0.0.0.0:8088",
        "splunk-token": "hvsjdcjkaadcjgfewgcvjvdsgk",
        "splunk-verify-connection": "false"
      }
    },
Sample Vector config to receive the std out logs in vector daemon.
[sources.ecs_container_stdout_log]
  type = "splunk_hec"
  address = "0.0.0.0:8088"
  token = "hvsjdcjkaadcjgfewgcvjvdsgk"
splunk-token can be anything, just we need make sure we use the same token in both ecs task definition & vector config.
Once everything configured, logs will be available in Opensearch for real time query different index file name.
Challenges In OpenSearch:
- Cluster Level sharding is limited to 1000
- By default it creates a 3 shared & 3 replicas for on index which results in 6 shard.
- If index were created on daily basic for each cluster & application, it will hit the limit and log failure will happen.
Solution:
- Creation of Index we strategised based on Cluster name followed by year, month and week on the year. ex: vector-ecscluster1-2023-04-16.
this will end up in one week data into one index file and easy to query the data fast. - Default 3 shared & 3 replicas reduced into 1 shared & 1 replica using index template.
- Created Index LifeCycle policy, when index age reach 30 days, it will be deleted.
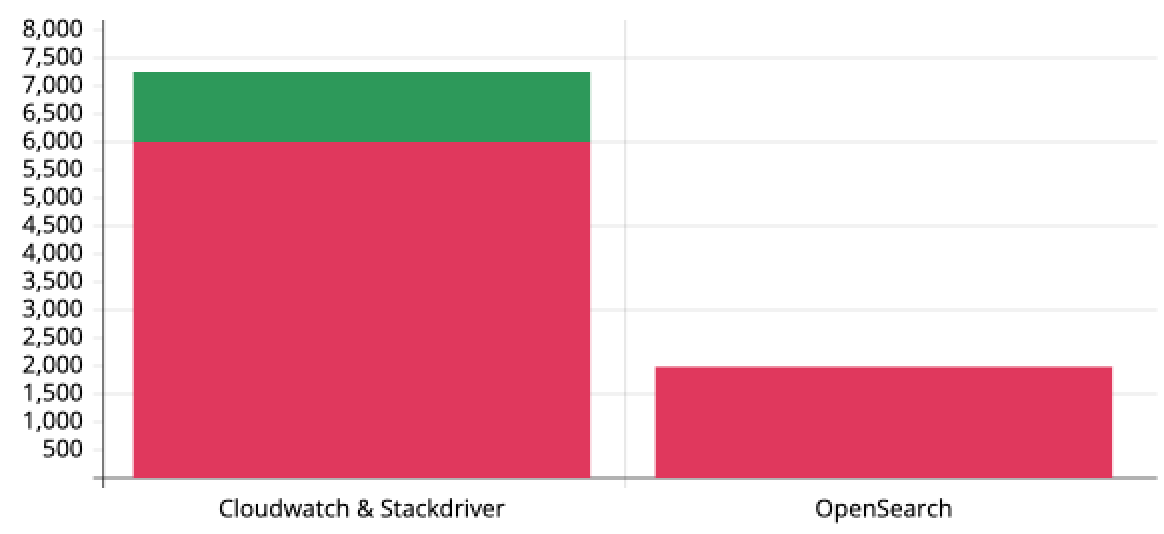
Cost Comparison:
Below graph shows Month-to-Month billing.
View Comments